tl;dr
- If you’re curious about the value of personal finance optimizations you can make, take a look at the chart below and the corresponding spreadsheet. It has a million caveats, but it provides a ballpark estimate for the value of many possible optimizations for a theoretical IC6 Software Engineer at Meta.
- The biggest takeaways for our theoretical engineer —and potentially you, if you’re similar to them— are:
- Once you hit a sufficient net worth, the return from investing your money (vs. holding it in cash) will dwarf anything else you can do. For our engineer it worked out to $69,609 / year. If you’re holding big piles of cash, make sure to consider that opportunity cost!
- Assuming you have the compensation to support all options, contribution limits are the biggest limiting factor on the value of the various tax advantaged accounts you have access to. For that reason the Mega Backdoor Roth 410k is king at $19,686 in value for our theoretical engineer. Compare that to a Health Savings Account which is more of a nice-to-have at an extreme best case of $4,343 in value for our engineer (and potentially a negative value). If you have both access and the funds to do it, a Mega Backdoor Roth 401k is definitely worth your while!
- If we add up the value of maximizing just their 401k (standard contribution + Mega Backdoor + company match), our engineer can get $43,608 in value for less than an hour’s work to set up.
- There’s a long tail of smaller optimizations you can consider doing if you have the capacity and interest, but everyone should make sure to at least hit the basics.
Introduction
This year, I’ve seen some less-than-optimal personal finance behaviours from friends and coworkers. Examples include:
- Keeping hundreds of thousands of dollars in a savings account (high yield, thankfully).
- Going years without signing up for a Mega Backdoor Roth 410k.
- Failing to use benefits available to them, like their free commuter money.
Sometimes these behaviours came down to lack of knowledge (ie. not knowing about the optimization at all). For people like that, there are plenty of great flowcharts you can follow. Many of the behaviours I saw, however, were due to lack of motivation. One contributing factor to that lack of motivation is not realizing the value of these optimizations. While I recognize that not everybody enjoys micro optimizing their finances like me, I do think everyone should be aware of the optimizations available to them, and the value of said optimizations. Then, they can make an informed decision about which optimizations are worth the time, effort, mental overhead, and (at least in some cases) risk.
This chart is my attempt to aid that informed decision making by putting a value on the optimizations I often recommend to people:
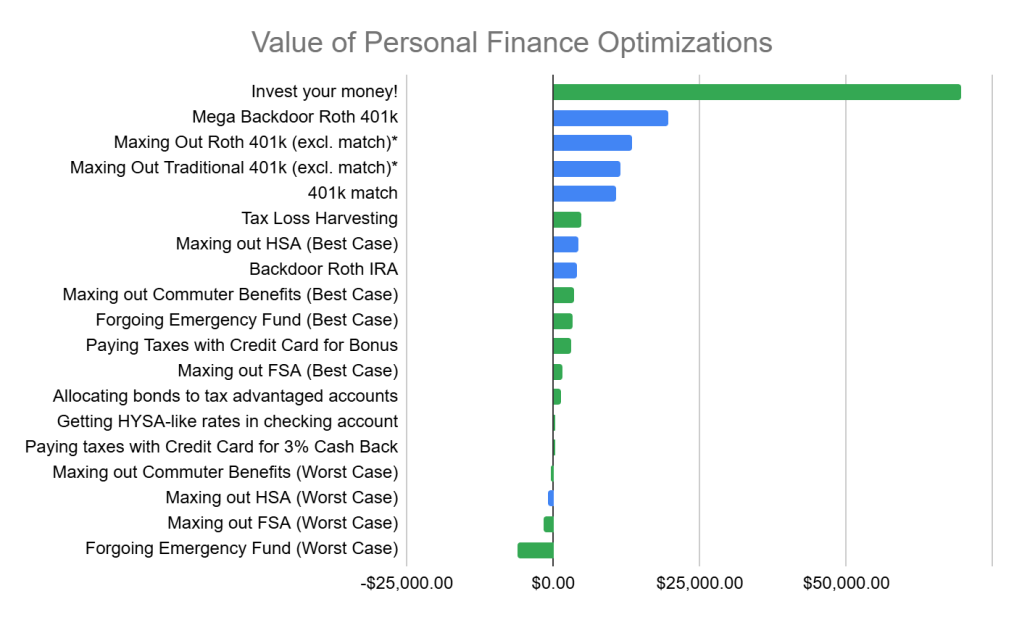
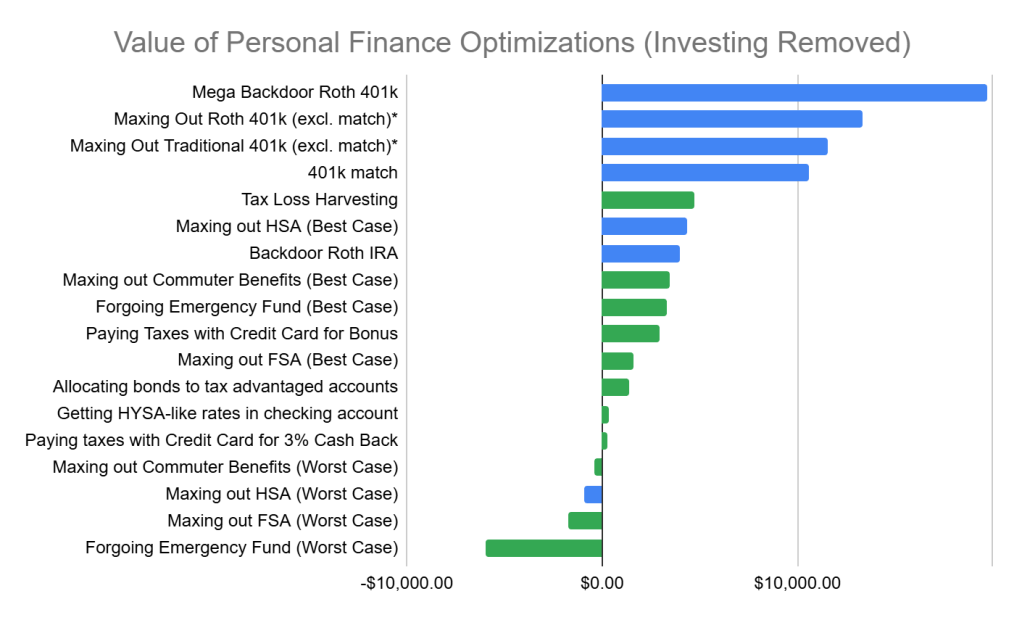
“Invest your money!” is huge (we’ll discuss that later), but it also makes the rest of the chart hard to read. Here’s a version with it removed:
Read on to understand the nuance of these charts, and my conclusions from them.
Understanding the Chart
Reading the Chart
This chart describes the value of common optimizations, from the perspective of a theoretical IC6 engineer at Meta in New York City, based on dozens of parameters that I thought were sane defaults. There are two different colors of bars on the chart, because there is some nuance to the financial optimizations discussed. Some optimizations result in more money in your account this year. Others result in deferral of taxes that will benefit you in retirement. The different colors separate these two buckets. Here’s how they are calculated:
- Green Bars: Indicate how much additional post-income-tax money / stock you will have in your account at the end of the year, assuming you applied these optimizations on January 1.
- As an example, our theoretical Meta engineer earns an average 8.05% yield on their $1,000,000 investment account. That yield is reduced to 6.96% by the taxes they have to pay on the bond coupon and stock dividends. Thus they will have $69,6091 more in their investment account at the end of the year2, and $69,609 is what we put on the chart for “Invest your money!”
- Blue Bars: Indicate how much additional post-tax money you would have to invest in a non-tax advantaged account to have the same amount of money in retirement as you would have had using the tax advantaged account.
- As an example, a Mega Backdoor Roth 410k enables our Meta engineer to avoid paying yearly capital gains taxes on dividends. It also enables them to avoid paying capital gains taxes on the increase in the value of the stocks they hold, when they finally sell. $34,750 put in a Roth 401k in 2025 could grow into $354,566 over 30 years at 8.05%, and they get to keep that full $354,566 in retirement. Using the calculations from the spreadsheet, our theoretical Meta engineer would need to put $54,436 into a regular investment account to be able to access the same $354,566 in retirement after subtracting taxes. Thus, the value of putting $34,750 into a Roth 401k would show up on the chart as $54,436 – $34,750 = $19,686, because that’s how much more post-tax money our engineer would need to achieve the same benefit.
For an explanation of what each row means, check out the glossary at the bottom of this post.
Using the Chart Yourself: Caveat Emptor
You are welcome to make a copy of the sheet, and tweak the values in the “Parameters” tab, it is important to realize that this sheet is full of plenty of guesses and estimations (and probably some errors) that could dramatically change the values you come to. Reasons that my calculations might not match your actual reality include:
- Different Parameters: The default parameters may not apply to you. For example, the 0.47% alpha value for tax loss harvesting is based on a whole white paper that models many different scenarios and finds values between 0.04% and 1.27% (and that value changes over time and with portfolio).
- Different Calculation Methodologies: The very formulas in my spreadsheet have some built in assumptions. For example, when calculating taxes on retirement withdrawals, I use marginal tax rates while some would argue you should use effective tax rates. This biases against accounts like the Traditional 401k, which are subject to taxes in retirement.
- I assume you have enough money to do every optimization: I’m not evaluating the dollar-for-dollar tradeoffs between options. For example, contributing to a Roth 401k happens to be a bit ahead of a Traditional 401k in my chart above, but I’m not accounting for the fact it takes more money to fund a Roth 401k than a Traditional 401k (because Roth dollars are post-tax vs Traditional dollars are pre-tax)
- My present value calculations are debatable: As described in the “Blue Bars” explanation above, I value retirement benefits in terms of “how much would I have to invest in a taxable account now to get the same benefit in retirement”. That’s effectively doing a present value calculation using the post-tax rate of return of my investment account (currently defaulted to a 3-Fund Portfolio). Reasonable alternative methodologies include using estimated inflation (eg. the Fed’s 2% target inflation rate) to estimate the present day equivalent buying power of those future dollars, or using the “risk free rate of return”.
Ultimately, this chart is meant to motivate you with the size of various opportunities, not to give you an exact valuation of each optimization or help you trade off between them based on tiny differences. Please, don’t try to use it for more than it was intended.
Observations
Looking at this chart, there are some widely applicable lessons that stand out to me:
Investing Your Money is the Most Important Thing
While this is not true in every scenario, once you have sufficient assets the returns from investing your portfolio vs holding cash will dwarf your results from every other optimization. This is because:
- Investment returns can be substantial (eg. 9.9% in the S&P or 8.05% in a 3-Fund Portfolio)
- Most other optimizations have some sort of limit / cap that prevents them from scaling indefinitely.
There are many reasons people choose not to invest their money in stocks, some legitimate (eg. they have a near-term need for it, like buying a house) and some less so (eg. they think they can time the market and avoid a crash or buy a dip). If you’re one of the people in the latter category, hopefully seeing the scale of the returns you’re missing out on will help give you the kick you need to re-evaluate that position. If you’re afraid of investing your money because we might be at a market peak, give this a read.
Contribution Limits Bound Results; The Mega Backdoor 401k is King
The biggest determinators of where different tax advantaged accounts ended up on the chart was not a hotly debated topic like “Roth vs Traditional”, it was how much money you can put into those accounts. This makes sense when you consider the values I calculated for the different tax advantaged accounts. For each account, our Meta engineer putting a dollar into their account was equivalent to receiving an extra $X in a taxable investment account, where X was:
- Post-Tax Money, Tax Free Growth (eg. Roth): $0.57
- Pre-Tax Money, Taxed Withdrawn (eg. Traditional): $0.49
- Triple Tax Advantaged (eg. HSA): $0.94
Each of those numbers has to be multiplied by how many dollars you can put into the accounts. That’s why the Mega Backdoor, with its $34,750 limit, is so much higher than the HSA with its $4,300 limit even though the HSA has got a higher dollar-for-dollar return.
The lesson? If you’re deciding whether a given optimization is worth your time to set up, the contribution limit is perhaps the biggest deciding factor for its value.
Free Money (401k Match, Commuter Benefits) Punches Above its Weight
When considering the value of a contribution to a tax advantaged account like a 401k, we have to compare it to the alternative of paying taxes on the money and putting it into a regular investment account instead (which still has a non-negligible return). When looking at instances where your company gives you free money, like 401k Matches, Commuter Benefit Accounts, or HSAs, the alternative we’re comparing to is no money at all. So even relatively small seeming amounts of free money like Meta’s monthly $260 in commuter benefit money end up fairly high on the chart because they have the advantage of being compared to fully funding your commute expenses out-of-pocket with post-tax dollars.
The lesson? If your company offers free money, take it3!
HSAs are Over Hyped
Given how HSAs are often hyped as some secret trick of the rich, I was surprised to see how low in the chart it ended up being. And I genuinely tried to evaluate it with the best possible case for an HSA, making some extreme assumptions that our example Meta engineer:
- Had zero medical costs now, meaning they didn’t increase their medical expenses by switching from an EPO to HDHP plan (and in fact, they saved money because the HDHP has a lower paycheck deduction).
- Had high medical costs in the future, meaning they got to withdraw all the money in their account tax free (as opposed to paying income taxes on non-medical expense withdrawals)
Even with those assumptions, that account was worth at best the equivalent of an extra $4,343 in a taxable brokerage account. With proportionately extreme negative assumptions, the account actually had a negative value equivalent to losing -$946 from a taxable brokerage account. The reality for most people is probably somewhere in between the best and worst case. The reason the best-case benefits of the HSA are smaller than I had assumed comes down to the contribution limit issue I covered above.
As someone who doesn’t have an HSA for psychological reasons rather than personal finance reasons, I’m glad to see the account is a bit overhyped. While I am missing out on some potential upside, it’s small enough for me to make peace with it.
Some Optimizations can Result in Losses
Four of the optimizations that I modeled had worst case scenarios that resulted in losses4. For two optimizations, the potential losses were due to use-it-or-lose-it type clauses: FSA money is lost if not spent in the year it’s designated for5 and Commuter Benefits money is lost if you leave your company. For Forgoing an Emergency Fund, the optimization can go negative due to the very real risk of having an emergency at an inopportune time, which I covered in depth in this three part series. Finally, for the HSA, you have to be on a High Deductible Health Plan (HDHP) to get an HSA, which can turn appointments that typically have a small and fixed copay into larger expenses with deductibles and coinsurance requirements.
The lesson? Make sure you know the potential downsides of any optimization you attempt, so you can avoid it or accept the risk.
Some of my “Micro Optimizations” aren’t so Micro, while Others Are
I am often (rightly) accused of micro optimizing. I found it interesting to see that some of the less conventional optimizations that I do, like forgoing an emergency fund and paying taxes with credit cards outperformed more conventional advice like having an FSA or allocating bonds to tax advantaged accounts. Other tricks, however, like using a Fidelity account invested in Money Market funds to get High Yield Savings Account (HYSA) like rates, were profitable but barely registered as a blip on the chart when compared to other optimizations.
The lesson? While this chart will look very different for people with different financial situations, some of my less conventional optimizations offer a decent return!
Hourly Values
For a different perspective, I guesstimated how long each optimization takes to implement, and put the chart in terms of dollars per hour of effort:
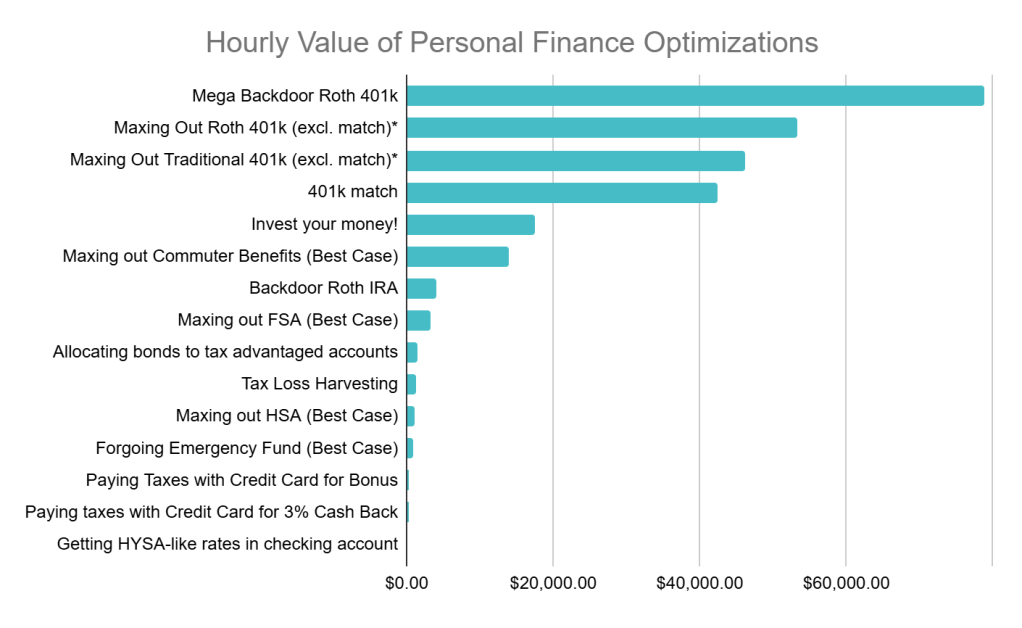
This chart has even more caveats to general applicability including, but not limited to:
- The estimates are pretty arbitrary, and will vary wildly from person to person
- The estimates are for first year setup + learning cost, but ignore the ongoing zero-cost value in subsequent years (eg. for the HYSA-like rates optimization, the whole point is that once the account is set up there is no manual maintenance needed to keep earning those rates)
While my guesstimation fudges this chart so heavily it could be sold in a chocolate shop, I hope one takeaway is abundantly clear: Doing a standard 401k (Roth or Traditional) + doing a Mega Backdoor 401k + getting your employer match has an ROI of thousands of dollars per hour. In fact, adding up the values for our theoretical engineer we get $43,608 for less than an hour’s work. No matter how much you dislike / are uninterested in personal finance matters, it’s worth your while to at least do those optimizations (assuming you have the income to support them).
Notable Omissions
When making this chart, there were some other candidate optimizations that I did end up leaving out:
- Picking the Right Investment: Investing in the S&P 500 vs a 3-Fund Portfolio vs NVDA will make a big difference in your returns (potentially dwarfing the numbers on this chart if you hit the jackpot). I intentionally did not include such a comparison because:
- One of my rules is that I won’t pick your investments for you.
- Whatever your preferred investment choice, you can still super-size your returns using the optimizations described in this post (eg. you can still buy your NVDA in your Roth 401k if you prefer, and your gains will be tax free).
- Rebalancing Investments: Rebalancing is about working to keep the percentages of each asset in your portfolio at their target values, in response to their values going up and down. The effect on yields (positive or negative) depends heavily on the particular investment mix you have. Additionally, one of the main benefits is risk reduction, which wouldn’t be captured in a dollar-denominated chart. Finally, rebalancing is just more annoying to simulate, especially when considering tax consequences. So rebalancing is an optimization worth considering, but it will have to wait for a future update to this post to be included.
- Diversification out of RSUs: For workers that receive Restricted Stock Units (RSUs) as compensation, it is common advice for them to sell those RSUs and diversify into ETFs. Including diversification in the chart felt meaningless, because the outcome is highly company-specific and I can construct extreme examples in both directions. If you’re curious to simulate the effects of diversification for your RSUs, Andre over at FAANG FIRE has a handy little dashboard you can use.
- Negotiating (House, Job, Car, Loans, etc.) & Increasing Your Compensation: Some of the highest ROI things I’ve done have included negotiating the price of my home, negotiating my pay package when changing companies, and earning raises at work. While I’ve covered some of those topics, and plan to cover others in the future, ultimately they felt too far afield from the scope of this post. For this post, I wanted to keep the focus more narrowly on how-to-move-and-store-money type optimizations.
Conclusion
Hopefully I’ve provided enough caveats that you won’t get too hung up on the exact values in these charts. What I do hope you will get hung up on is that some of these optimizations can be quite valuable, and some are more nice-to-have. If you don’t love spending time on personal finance stuff, try to do the bare minimum of taking full advantage of your 401k (including the Mega Backdoor option if you have it!) and other free money your employer may offer you. If you love micro-optimizing like me, run through the full chart and optimize to your heart’s content; but always make sure it’s worth your time invested (eg. see my $200 / hour rule). For me personally, putting together this post has really helped me feel good about doing the big things right, and not sweat the things I’ve opted out of (eg. HSA).
Glossary of Optimizations
This post isn’t about explaining all the optimizations themselves. But below is a quick glossary to give you explanations of each optimization if you’re not familiar with them. Note that when I talk about “best case” and “worst case” below, I’m talking about the scenarios where the account offers the highest / lowest value; that isn’t always correlated to what is a good / bad situation to find yourself in (and if fact can be inversely correlated because the best case for some medical-related accounts is having high medical expenses).
- Invest your money: This is about putting your money in some kind of investment (eg. stocks), instead of holding it as cash in a checking account earning near 0% interest. Common choices include the S&P 500 which has historically averaged a 9.9% return or a 3-Fund Portfolio which has historically averaged a 8.05% return.
- Mega Backdoor Roth 401k: This is about taking advantage of the Mega Backdoor Roth 401k to (completely legally!) contribute extra money to your Roth 401k, beyond 2025’s $23,500 401k contribution cap. Doing so allows your money to grow without tax drag and be withdrawn tax free in retirement. Andre over at FAANG FIRE has a guide for how to set this up if your company uses Fidelity for 401ks.
- Maxing Out Roth 401k (excl. match): This is about the value of contributing 2025’s max of $23,500 to your Roth 401k account. Doing so allows your money to grow without tax drag and be withdrawn tax free in retirement.
- Maxing Out Traditional 401k (excl. match): This is about the value of contributing 2025’s max of $23,500 to your Traditional 401k account. Doing so allows your money to grow without tax drag on dividends, but it is subject to income tax (hopefully lower than your current marginal rate) when withdrawn.
- 401k match: This is about the value of the employer-provided money deposited in your pre-tax6 401k account. In addition to being free money from your employer, that money is also deposited in an account that allows it to grow without tax drag on dividends, but subject to income tax when withdrawn.
- Tax Loss Harvesting: This is about selling stocks at a loss, and buying similar ones, to lock in the loss for tax purposes. The act of buying something similar means you don’t miss out on the upside when the stock bounces back. The losses can save you money by reducing your taxes on capital gains, and even reducing your taxable income by up to $3,000 / year.
- Maxing out HSA: This is about taking advantage of a Health Savings Account (HSA) to get a “triple tax advantaged” investment vehicle (so called, because money is deposited pre-tax, grows without tax drag, and can be withdrawn tax free for medical expenses). Doing so gives you a major tax advantage for your invested money, but has downside risk because it requires you to be on a High Deductible Health Plan (HDHP), which may increase your out of pocket costs.
- Best Case: Maxing out the account, having no medical expenses now, and then having incredibly high medical expenses in retirement (thus allowing you to withdraw your contributions tax free)7.
- Worst Case: Switching to an HDHP skyrockets your current medical expenses (eg. $100,000 ER visit could cost only $100 under an EPO plan but could hit your full out-of-pocket max on an HDHP), and in retirement having no medical expenses (thus, not being able to unlock tax free withdrawal on the full value of your HSA).
- Backdoor Roth IRA: Similar to the Mega Backdoor Roth 401k above, this is about taking advantage of a completely legal trick to contribute money to a Roth IRA even if you’re over the 2025 $161,000 income limit. Doing so allows your money to grow without tax drag and be withdrawn tax free in retirement.
- Maxing out Commuter Benefits: This is about paying for your regular commuting expenses with the pre-tax paycheck deductions and tax free employer-provided funds that employers are allowed to offer. Depending on how generous your employer is and how much your commute expenses are, this can make your commute completely free.
- Best Case: Having commute costs equal to or greater than the size of your commuter benefits account, and paying for it all with that pre-tax money.
- Worst Case: Maxing out the value of your account, then leaving your employer and forfeiting all the money.
- Forgoing Emergency Fund: This is about forgoing an emergency fund to invest the money in instead. I covered the very real risks and potential benefits of this in a three part series.
- Best Case: Never having an emergency, and only profiting from investing the extra money.
- Worst Case: Investing your money, having the value of your investment crash, and then having an emergency immediately post crash (thus, having to sell at a loss).
- Paying Taxes with Credit Card for Bonus: This is about getting credit cards with sign up bonuses, and paying your taxes with those credit cards. I described this trick in a previous post.
- Maxing out FSA: This is about paying for medical expenses using pre-tax dollars deposited in a Flexible Spending Account (FSA). Doing so allows you to have more money in your pocket by spending dollars that would have otherwise gone to taxes, but it has a downside risk because you can lose unspent dollars.
- Best Case: Maxing out your FSA, and needing every dollar for medical expenses.
- Worst Case: Maxing out your FSA, having no medical expenses, and having to forfeit all your contributions.
- Allocating bonds to tax advantaged accounts: Investment returns via bond coupons are different from stocks increasing in value, because bond coupons are taxed as income in the year you receive them vs stock gains are taxed when you sell. This taxation introduces tax drag on your bond investments8, by removing some money that could have otherwise been reinvested and experienced compounding returns. This point is about strategically holding bonds in tax-advantaged accounts to avoid that tax drag.
- Getting HYSA-like rates in checking account: Checking accounts often earn 0%, or near it, on the cash held in them. This optimization is about using a strategy like I outlined in this post to get higher interest rates on the float you keep in your checking account.
- Paying taxes with Credit Card for 3% Cash Back: Using a credit card that earns more than the 1.82% fee it costs to pay your taxes with a credit card, such as the PayPal card that earns 3% (not an affiliate link). I described this trick in a previous post.
- I swear, I did not intentionally pick parameters to produce a number that might be funny to some more juvenile-minded folks. ↩︎
- Note that this is an incomplete picture because it doesn’t include the capital gains tax they may eventually have to pay on the unrealized gains. It also leaves out smaller factors like the effects of reinvesting dividends throughout the year and strategically deferring paying taxes. ↩︎
- Note that when I say “free money” I mean money that is truly free, with no other associated costs, such as commuter benefit and 401k match money. Some benefits you may think of as “free”, such as a wellness benefit, are actually taxable benefits. Taxable benefits increase your W2 income, and thus you pay income tax on them. If you’re in a high tax bracket, that “free” taxable benefit is really more like a 50% discount instead. You should be careful when taking advantage of such benefits, and make sure you’re OK with paying 50% of the cost of that “free” thing you’re receiving ↩︎
- Technically, any of the optimizations that involve investing your money at any point in the process could result in losses. But I’m working from the assumption that our chosen investments will be well diversified, and even if there are down years they will go up over the long run. This assumption may not hold if you choose to YOLO your entire 401k into NVDA. ↩︎
- Employers are allowed, but not required, to let you roll over a portion of your FSA into next year’s account. ↩︎
- Historically, 401k Matches have had to go into your Traditional 401k account, even if the match was for money put into a Roth 401k account. As of the SECURE 2.0 act in 2022, employers are allowed to deposit the match into your Roth 401k account, but many employers (including Meta) do not yet support it. ↩︎
- I may have biased too hard in favour of HSAs in this scenario. That is because you can deduct medical expenses that reach 7.5% of your gross income. If retirement medical expenses in our best case scenario exceed 7.5% of gross income (plausible, given that I’m assuming high retirement medical expenses), then the tax-free withdrawal benefit of the HSA ceases to be as beneficial. This happens because you can’t both pay an expense from your HSA and deduct it. ↩︎
- Stocks can also have tax drag on their dividends, and this is factored into the calculations on the spreadsheet. In something like a 3-Fund Portfolio, stock dividends tend to be lower than bond coupons and they are often “qualified” meaning they are taxed at a lower rate. Thus, even though stocks also experience tax drag, it’s frequently worse on bonds and that’s why it’s often more optimal to hold them in a tax advantaged account ↩︎


Leave a comment